🔋 Renewable Energy Data Exploration

An analysis of the relationships between investment, job creation, and GHG emissions.

Project Overview

This project performs Exploratory Data Analysis (EDA) and hypothesis testing on the Kaggle Renewable Energy Dataset. Using Excel, it examines the relationships between financial investment, job creation, and environmental impact to provide data-driven insights for policymakers and investors.

Project Artifacts

📄 View Full Report 📊 View Excel Analysis

Problem Statement & Goals

Research Questions:

  1. In which renewable sector is the government investing more, and what is the proportion of government investment to job creation?
  2. What is the relationship between grid integration level and energy production/consumption?
  3. How does government investment relate to installed capacity and production?
  4. Dataset Overview

    Source: Kaggle Renewable Energy Dataset
    Description: Contains 15,000 records with 13 variables on renewable energy systems, including installed capacity, energy production, consumption, storage, investment, and environmental impact.
    Key Variables:

    • Type of Renewable Energy (Coded: 1-Solar, 2-Wind, etc.)
    • Installed Capacity (MW)
    • Energy Production (MWh/year)
    • Energy Consumption (MWh/year)
    • Energy Storage Capacity (MWh)
    • Storage Efficiency (%)
    • Grid Integration Level (Coded: 1-Fully Integrated, etc.)
    • Initial Investment (USD)
    • Funding Sources (Coded: 1-Government, 2-Private, etc.)
    • Financial Incentives (USD)
    • GHG Emission Reduction (tCO2e)
    • Air Pollution Reduction (Index)
    • Jobs Created

    Methodology & Assumptions

    The analysis was conducted in Excel, following a structured approach to ensure reproducibility. Detailed records of all steps, decisions, and their rationale were maintained throughout the project.

    Assumptions

    • The dataset is treated as a sample, not a complete population. This is because the quantitative variables show a near-uniform distribution, which is uncharacteristic of a full population dataset.
    • Further analysis could be enhanced by including geographical and time-series data, which are not present in this dataset.

    Data Processing Steps

    1. Data Validation: The dataset was checked for missing values and duplicates; none were found. Data types were confirmed to be correct.
    2. Outlier Detection: Outliers were assessed using the IQR method, box plots, and Z-scores. No significant outliers requiring removal were identified.
    3. Data Transformation:
      • Standardization: 'Installed_Capacity_MW' and 'Energy_Production_MWh' were standardized using Z-score normalization to prepare them for comparative analysis.
      • Categorization: Numerical variables like 'Installed Capacity' and 'Initial Investment' were categorized into high/low or high/medium/low groups to facilitate hypothesis testing (e.g., for Chi-squared and T-tests).
    4. Hypothesis Testing: Statistical tests were performed using Excel's Data Analysis ToolPak, including Odds Ratio, Chi-squared, T-test, ANOVA, and MANOVA to validate the research questions.

    Exploratory Analysis Visualizations

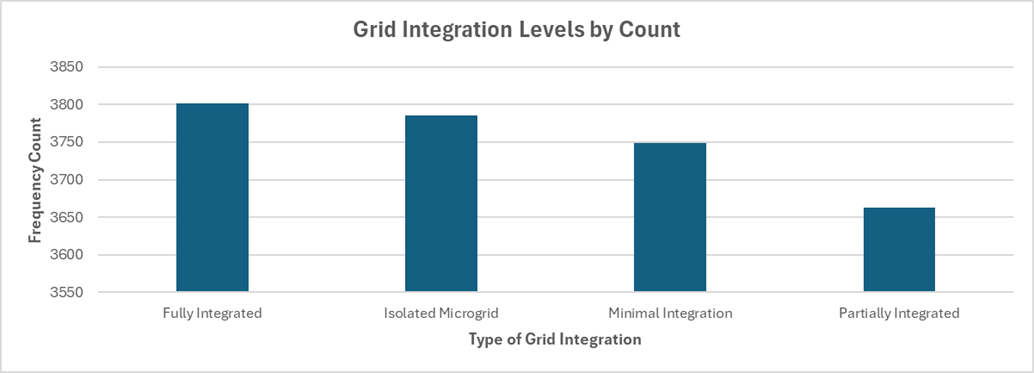
    As part of the initial exploratory data analysis, I generated several visualizations to understand the dataset's characteristics. The table of descriptive statistics provides a summary of the quantitative variables, while the bar chart shows the distribution of projects across different grid integration levels.

    Table of descriptive statistics for key variables in the dataset Bar chart showing the count of projects by grid integration level

    Hypothesis Testing Results

    Five hypotheses were tested statistically. The key findings are summarized below. For a non-technical audience, it's important to note that a p-value > 0.05 generally means we cannot conclude there is a real effect, and any observed differences are likely due to random chance.

    Hypothesis 1: Funding Source vs. Project Scale

    Objective: To determine if there is a relationship between the funding source (Government vs. Non-Government) and the scale of the project (Large vs. Small Capacity).

    • Test Used: Odds Ratio (OR)
    • Result: The Odds Ratio was 0.96, with a 95% Confidence Interval of [0.962, 0.967].
    • Conclusion: Since the confidence interval does not contain 1, we reject the null hypothesis. This indicates a statistically significant, albeit small, relationship. The odds of a project having a large installed capacity are slightly lower for government-funded projects compared to non-government funded ones.

    Hypothesis 2: Government Investment vs. Energy Type

    Objective: To determine if there is a significant association between government investment and the type of renewable energy.

    • Test Used: Chi-squared Test
    • Result: p-value = 0.4715.
    • Conclusion: Since the p-value is much greater than 0.05, we fail to reject the null hypothesis. There is no significant association between government investment levels and the type of renewable energy source.

    Hypothesis 3: Investment Level vs. Job Creation

    Objective: To determine if there is a significant difference in mean job creation between government projects with high and low initial investments.

    • Test Used: Two-Sample T-test
    • Result: p-value = 0.8051.
    • Conclusion: The p-value is very high, so we fail to reject the null hypothesis. There is no significant difference in the number of jobs created based on the level of initial government investment.

    Hypothesis 4: Grid Integration vs. Energy Production

    Objective: To determine if mean energy production differs across various grid integration levels.

    • Test Used: ANOVA
    • Result: p-value = 0.3501.
    • Conclusion: With a p-value greater than 0.05, we fail to reject the null hypothesis. There is no statistically significant difference in mean energy production among the different levels of grid integration.

    Hypothesis 5: Grid Integration vs. Production & Consumption

    Objective: To determine if grid integration level has a significant multivariate impact on both energy production and consumption.

    • Test Used: One-way MANOVA
    • Result: Wilks' Lambda p-value = 0.6899.
    • Conclusion: The p-value is high, so we fail to reject the null hypothesis. The grid integration level does not have a significant combined effect on energy production and consumption. Observed variations are likely due to random chance.

    Challenges & Learnings

    A key challenge was interpreting the near-uniform distribution of quantitative variables, which led to the assumption that the dataset was a sample rather than a complete population. This project reinforced the importance of rigorous data validation and hypothesis testing to avoid drawing conclusions from patterns that may be due to random chance.

    Conclusion & Next Steps

    The statistical analysis consistently showed no significant relationships between the key variables of interest: investment levels, job creation, and energy types or production levels. The only statistically significant finding was a very small effect where government-funded projects were slightly less likely to be large-scale. This suggests that within this dataset, factors other than investment levels (e.g., policy, technology, location) are likely the primary drivers of project outcomes. Future work should aim to incorporate these external variables for a more complete analysis.